Overview
Organizations lacked a centralized way to track their full emissions footprint. While EnergyCAP supported utility-driven scope 1 and 2 emissions, it did not support broader emissions categories like purchased goods, business travel, or employee commuting.
As a result, teams relied on spreadsheets and external tools, leading to fragmented workflows, inconsistent reporting, and limited visibility across their emissions data.
Goal
Design a centralized emissions tracking system that enables organizations to capture, manage, and report on all emissions data.
The system needed to support diverse emissions sources (including scope 3), flexible data input methods, and customizable reporting structures that reflect how organizations actually operate.
It also needed to integrate with existing EnergyCAP workflows while reducing reliance on spreadsheets and establishing a single source of truth.
Research & Discovery
User Research → Conducted 20+ interviews to uncover workflows, pain points, and gaps in emissions tracking
Competitive Analysis → Evaluated key carbon accounting platforms to identify industry patterns and gaps
Regulatory Research → Analyzed reporting standards to ensure the system aligned with compliance requirements and supported multiple reporting frameworks
Usability Testing → Ran tests in Maze on early wireflows to validate usability and refine core interactions
Design Approach
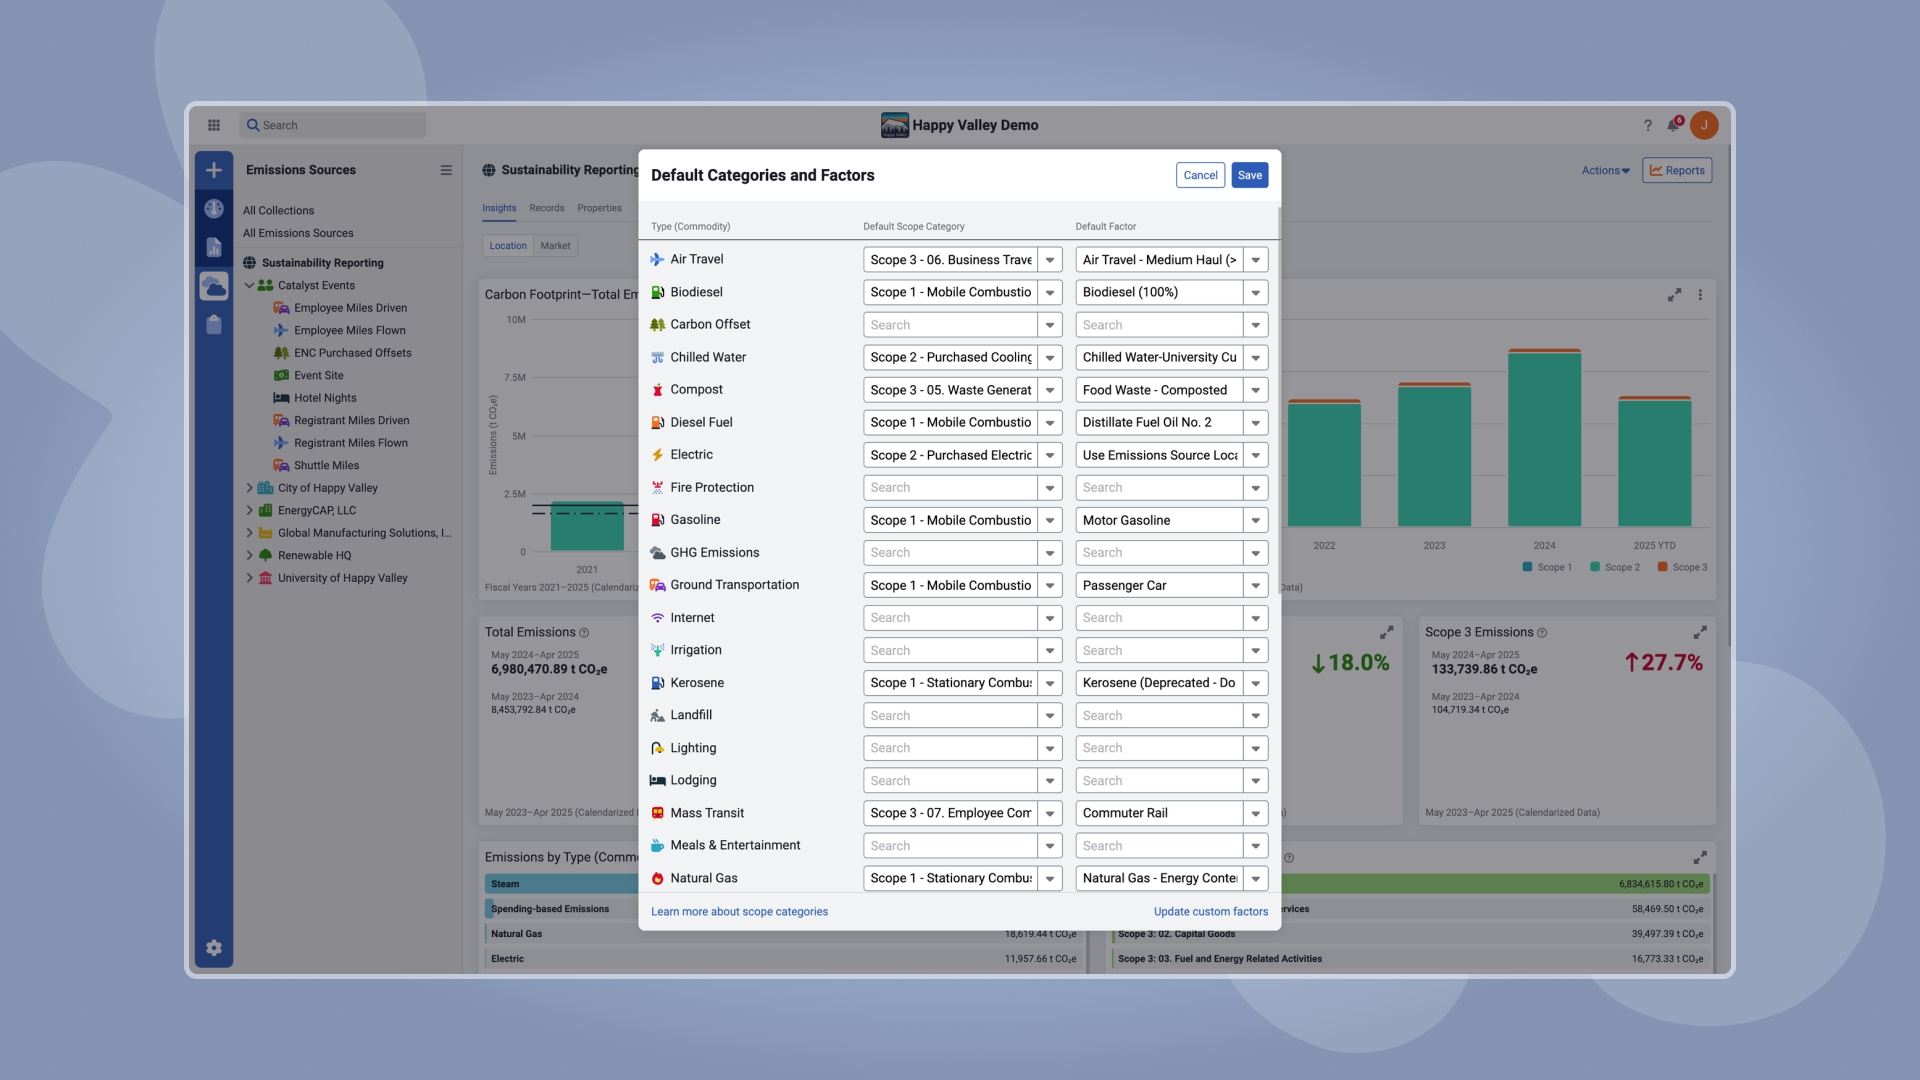
Data Modeling → Defined a flexible object model (collections, emissions sources, records) that decoupled emissions tracking from rigid facility hierarchies
Interaction Design → Designed end-to-end workflows for inputting, organizing, and analyzing emissions data across scopes 1, 2, and 3
Wireframing → Created low- to mid-fidelity wireframes to explore system relationships and align teams on structure early
Prototyping → Built interactive prototypes to validate key workflows and reduce ambiguity before development
Component Design → Developed reusable components in Figma to ensure consistency and scalability
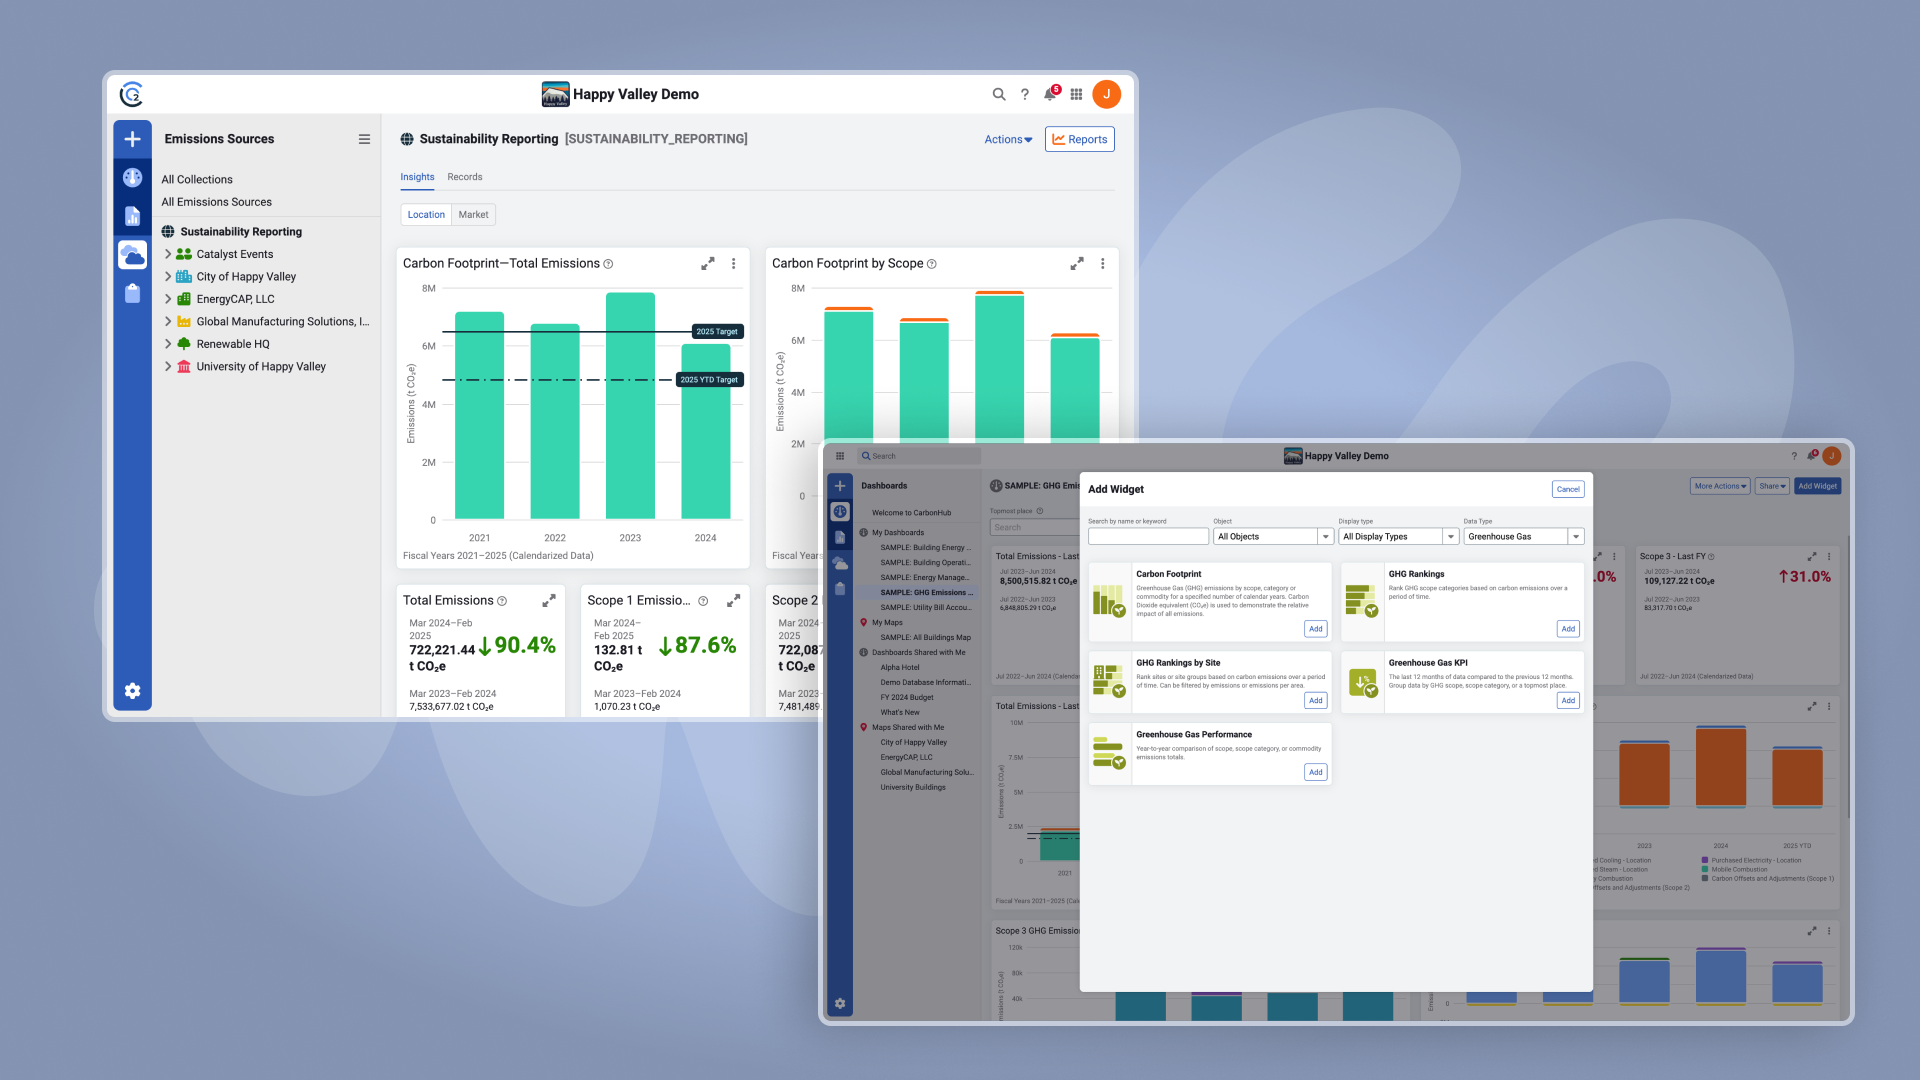
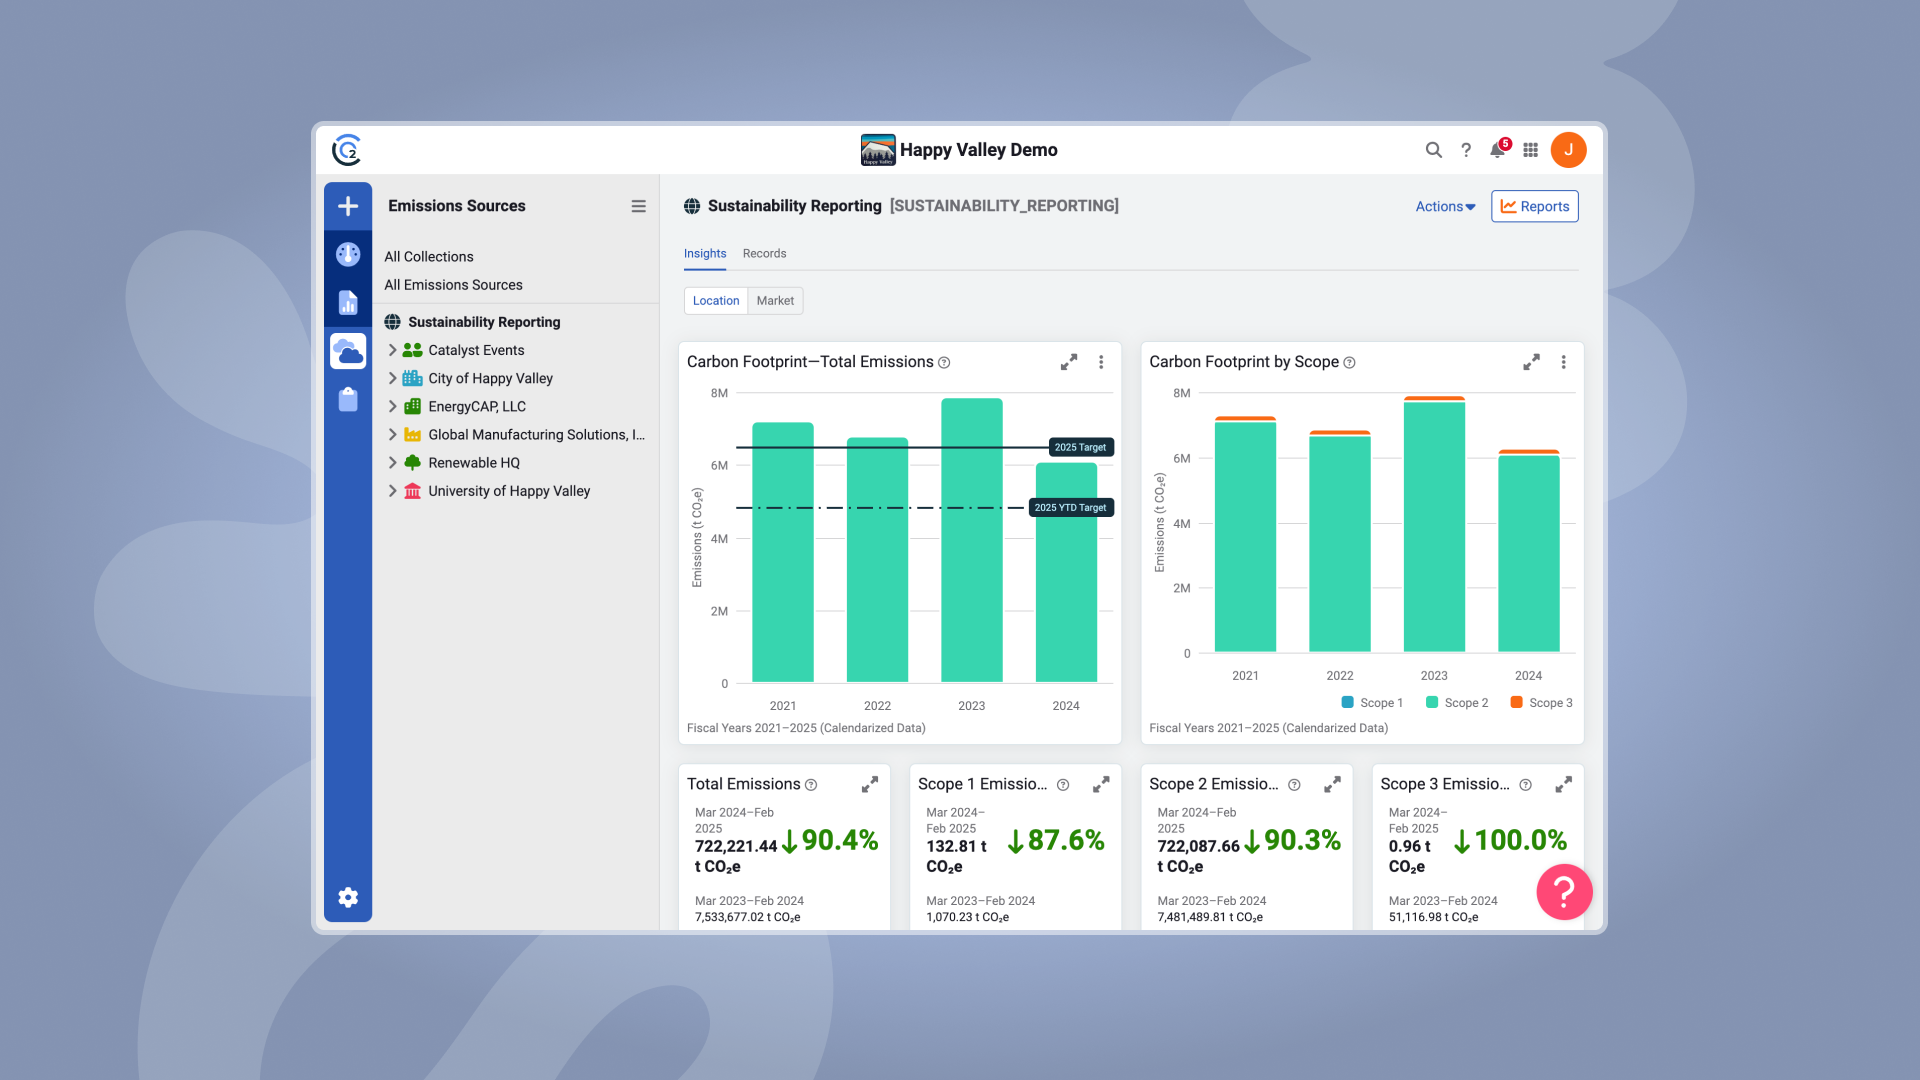
Domain-Specific UI → Designed emissions-focused widgets to surface insights and make complex data more understandable
Key Contributions
Cross-Functional Collaboration → Partnered with SMEs and engineering leads to define emissions logic and align on technical feasibility
Stakeholder Communication → Presented concepts and design direction to stakeholders, including engineering teams and C-suite executives, driving alignment on product strategy
Documentation → Maintained clear documentation in Miro and Confluence to support decision-making and cross-team transparency
Solution
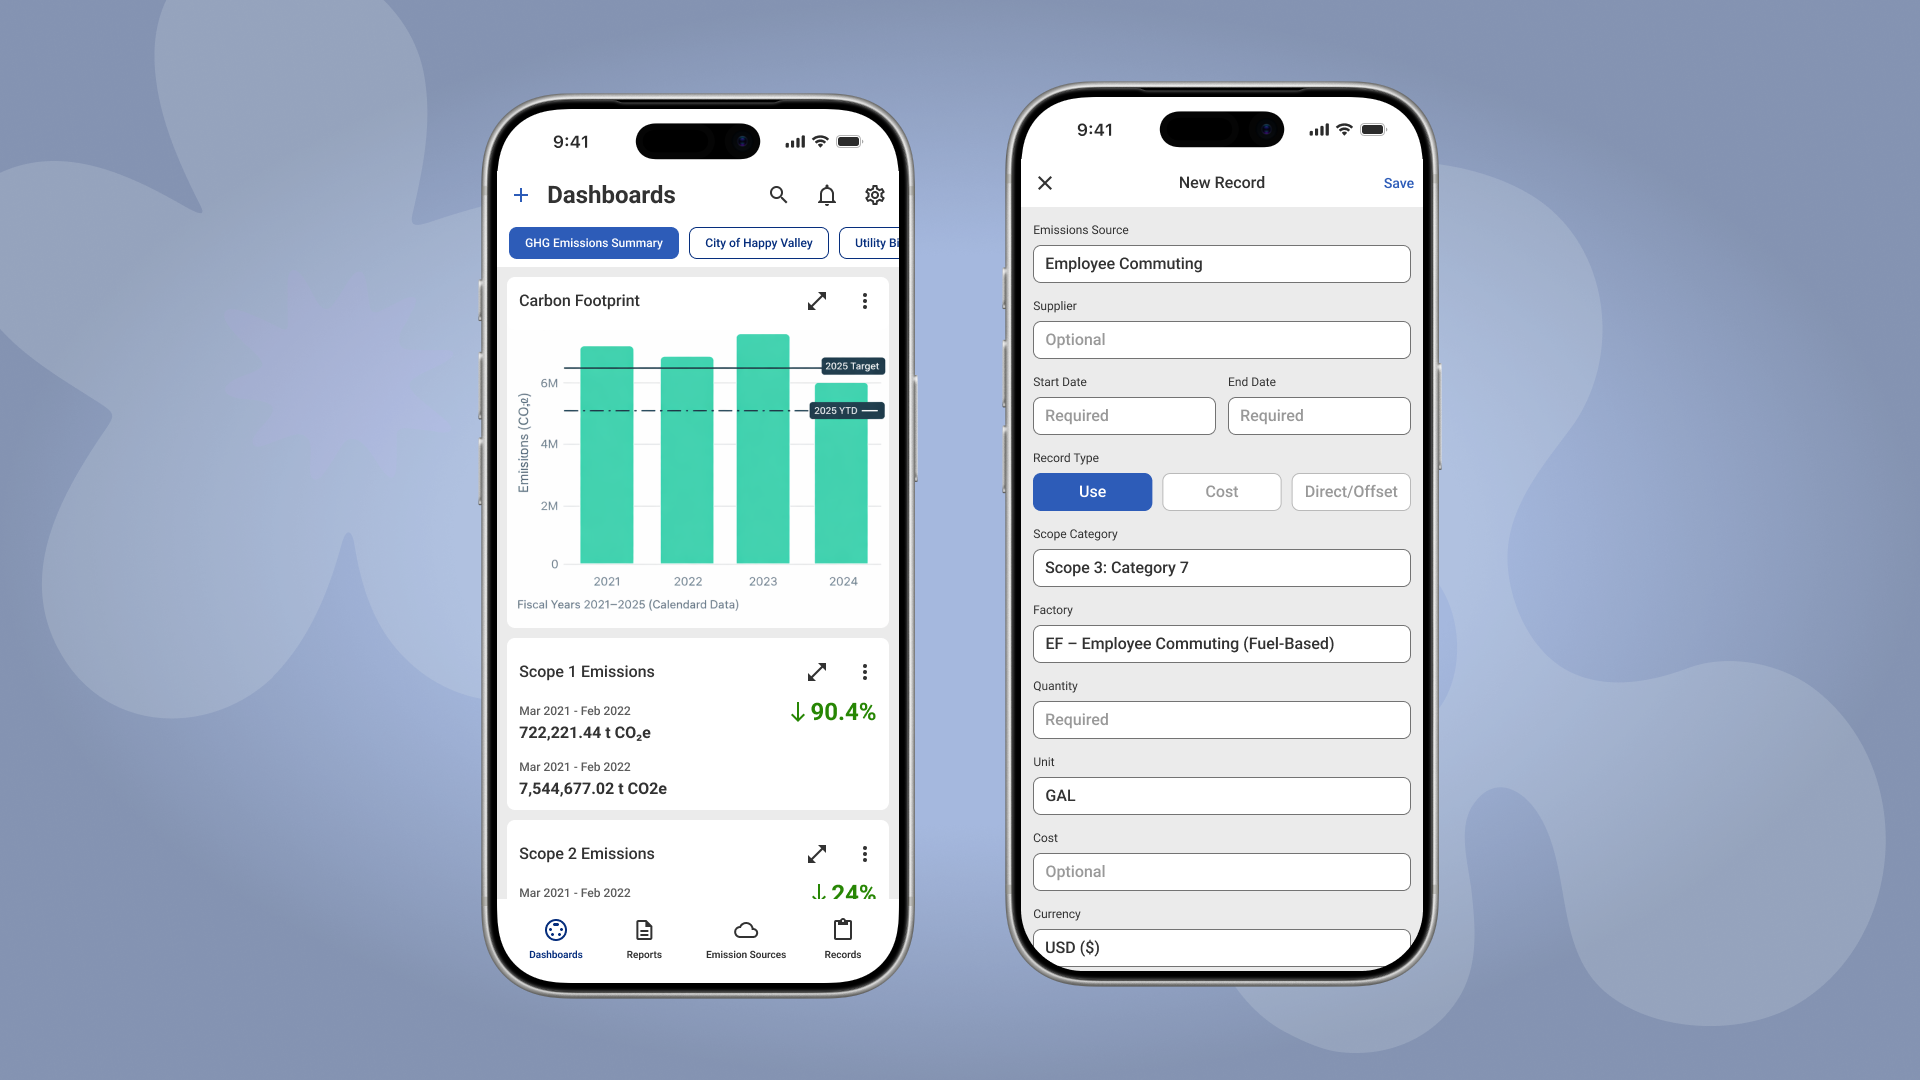
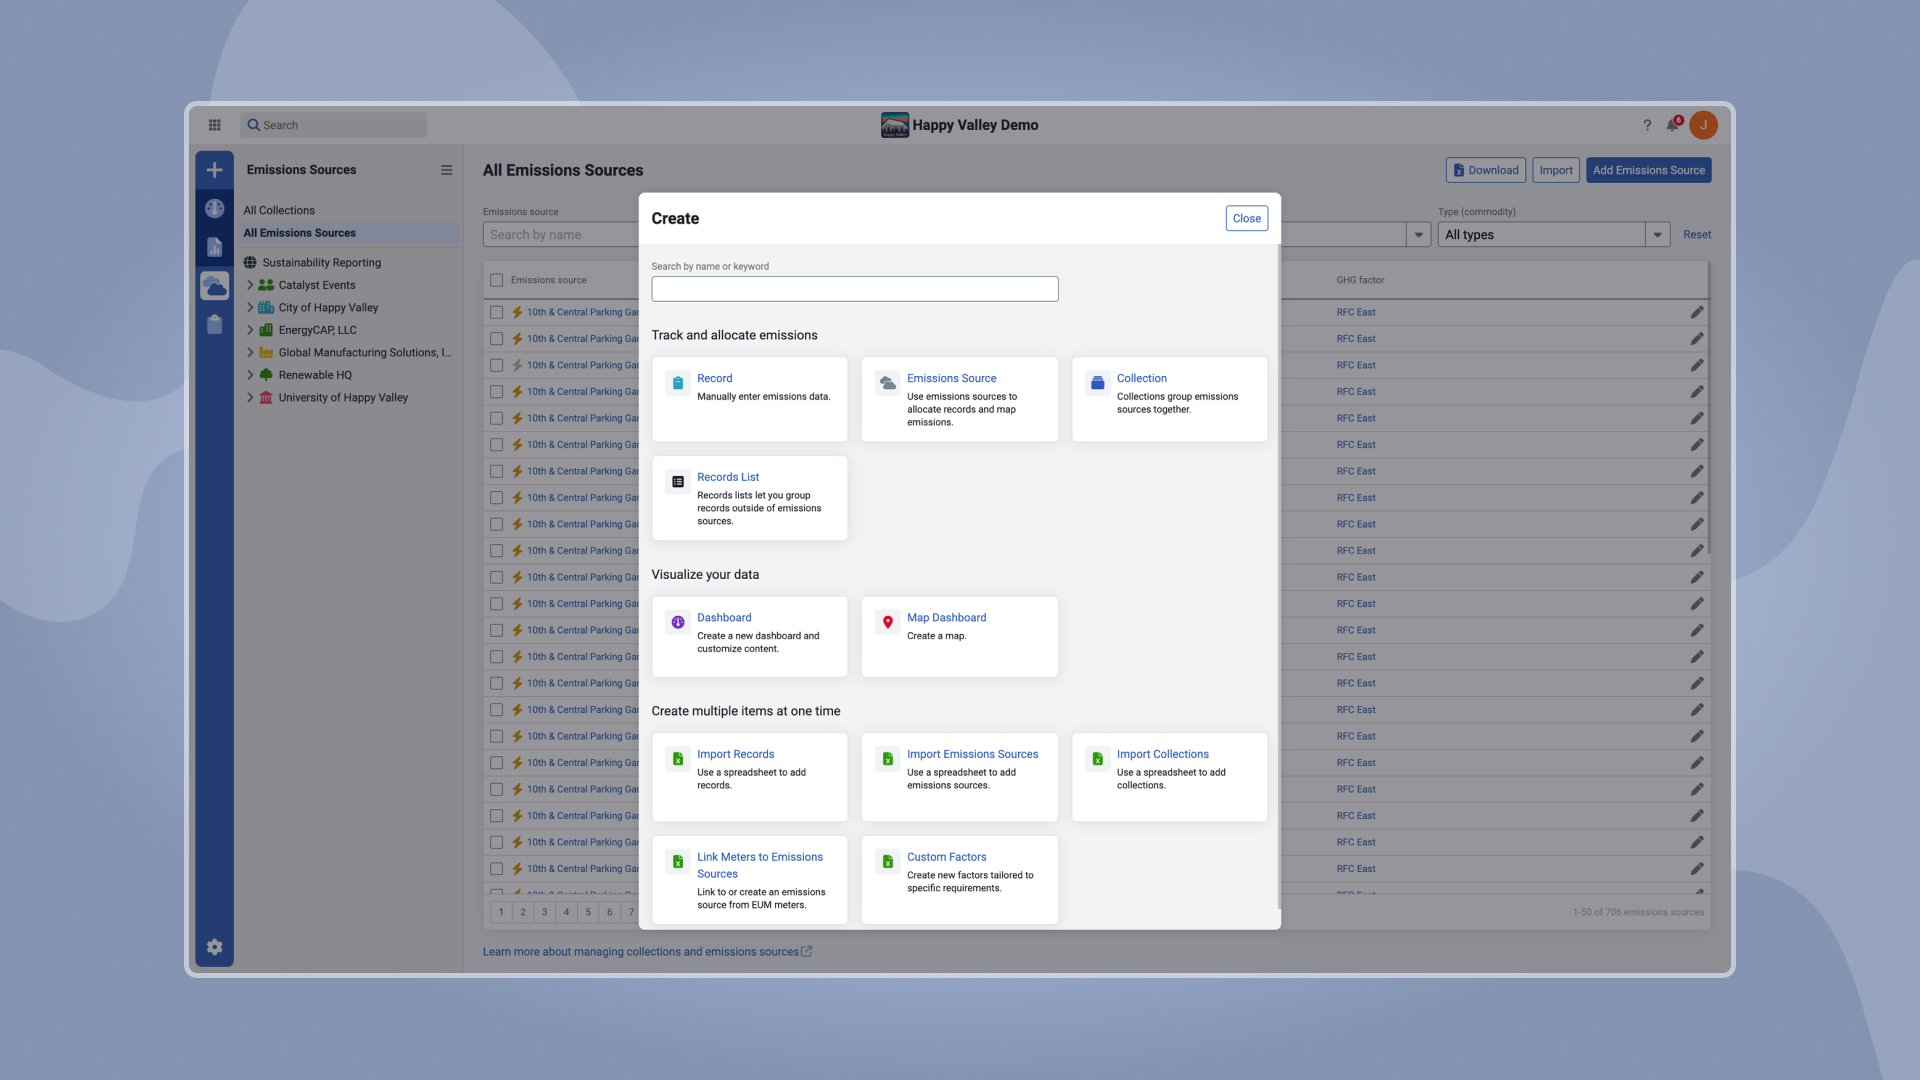
CarbonHub introduced a flexible data model built around Collections, Sources, and Records, allowing organizations to structure emissions data in ways that reflect their real-world operations rather than forcing a facility-based hierarchy.
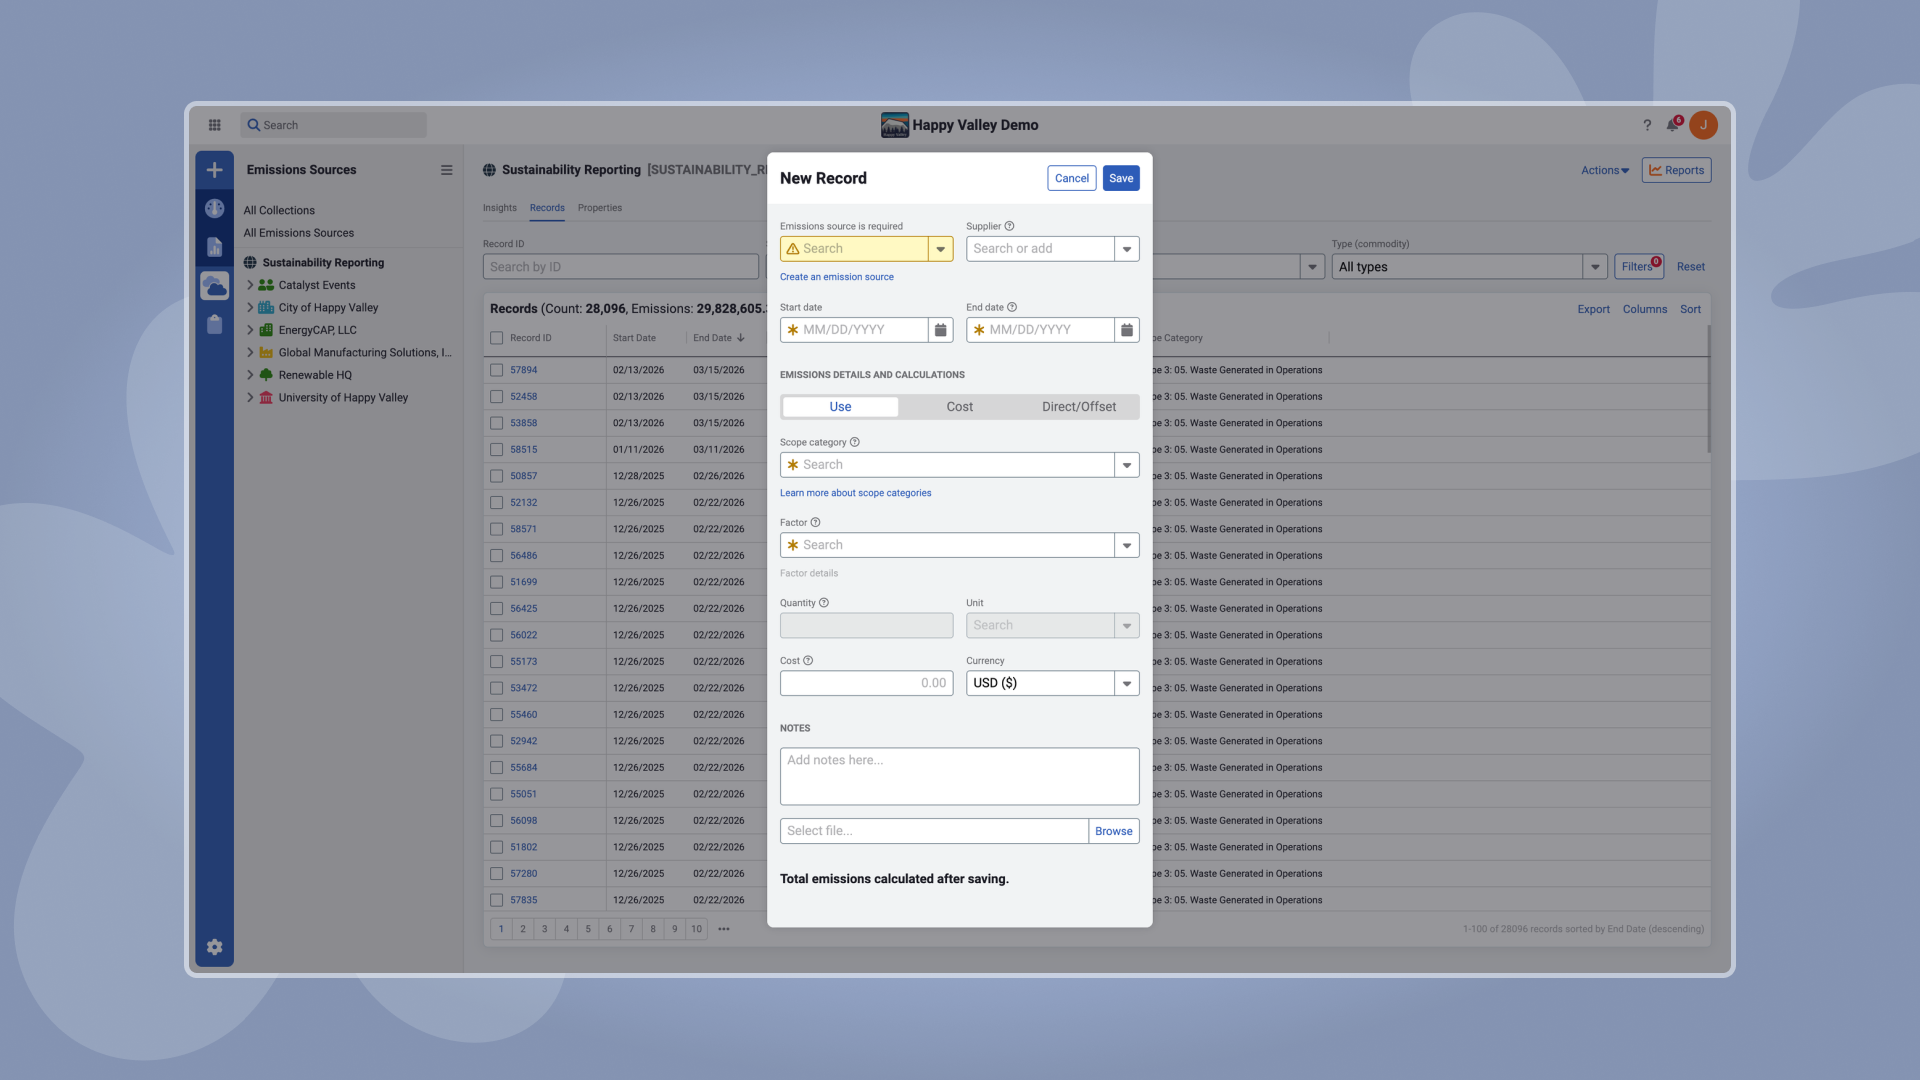
Users could combine automated emissions from EnergyCAP with manual inputs, enabling full coverage across scopes 1, 2, and 3.
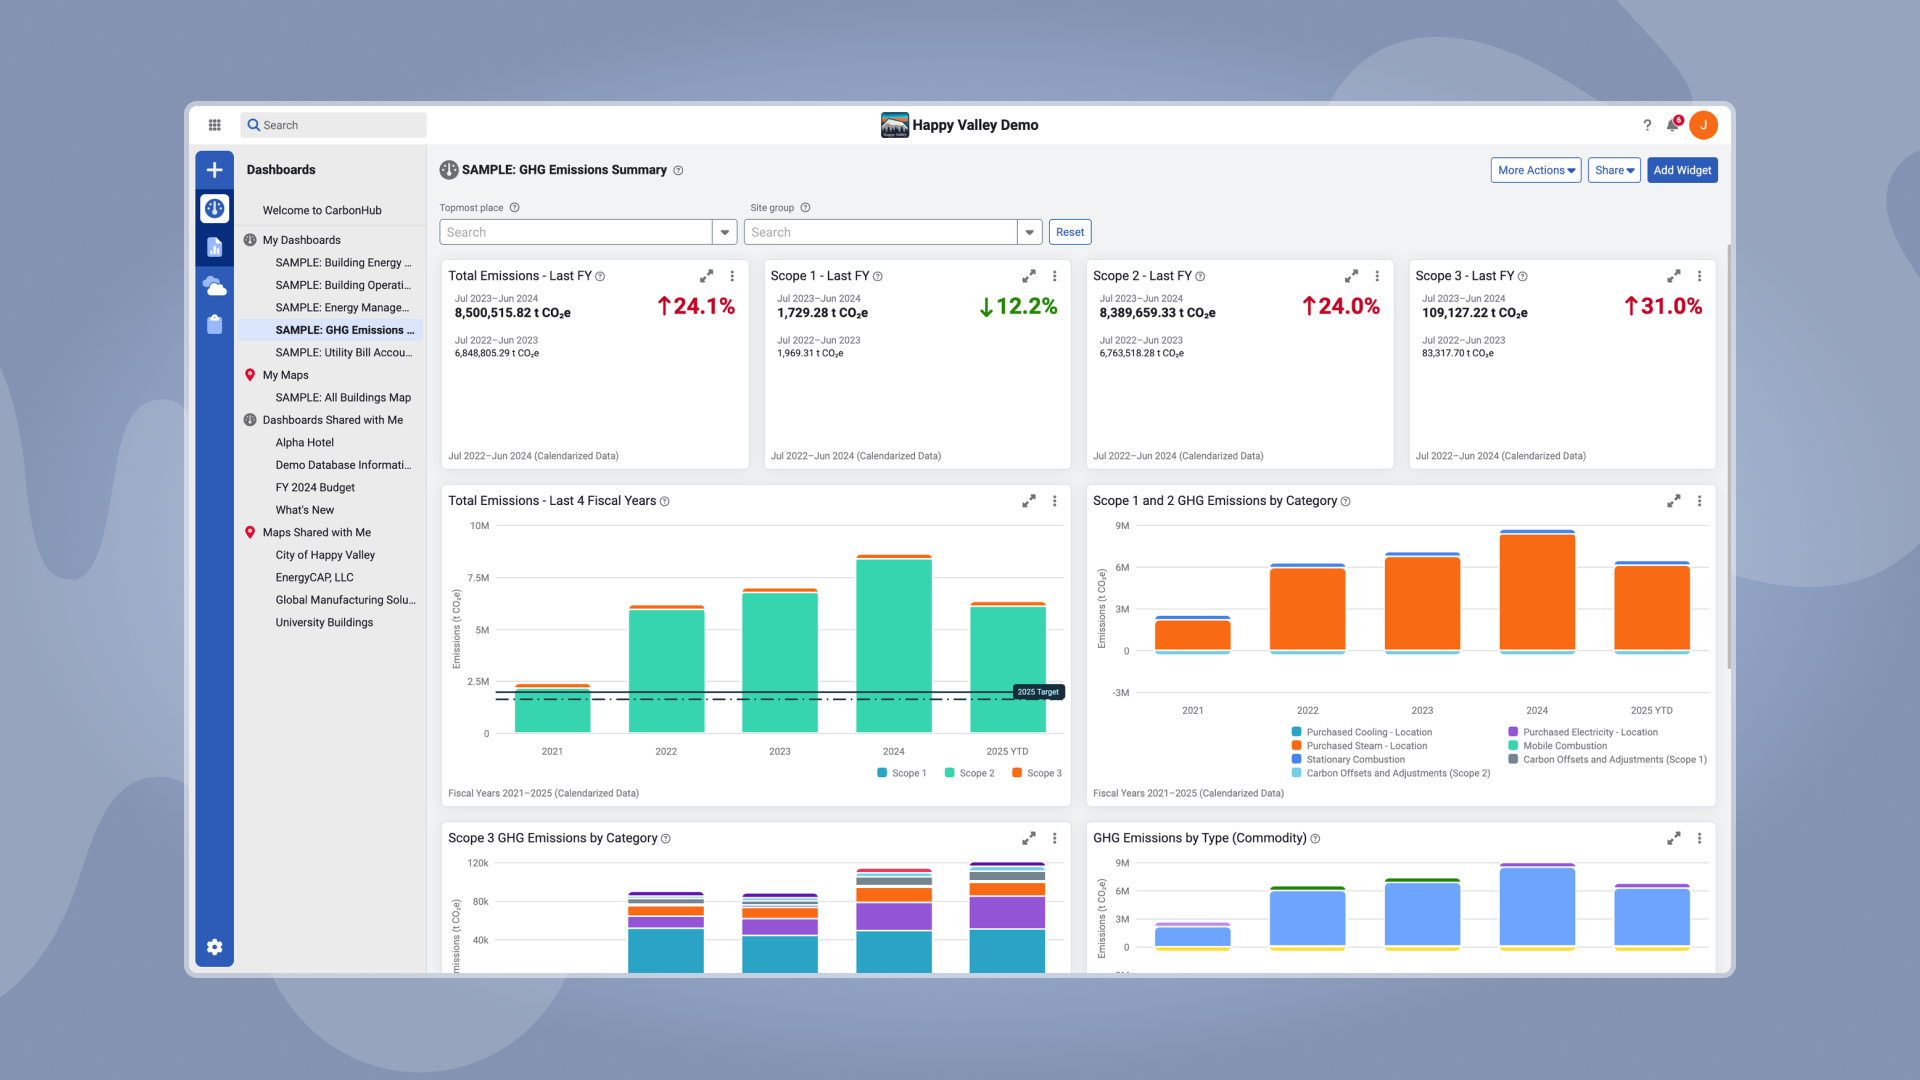
By integrating with existing EnergyCAP workflows while remaining a standalone system, CarbonHub created a centralized source of truth for emissions reporting.
The result was a more scalable and adaptable approach to emissions tracking, reducing reliance on spreadsheets and giving organizations clearer visibility into their full emissions footprint.